Logs
Application Logs
Shopware PaaS Native allows you to view your application’s logs for a given environment via Grafana.
To access Grafana, run the following command:
bash
sw-paas open grafanaThis command will provide you with the Grafana URL, username, and password.
Once logged in to Grafana:
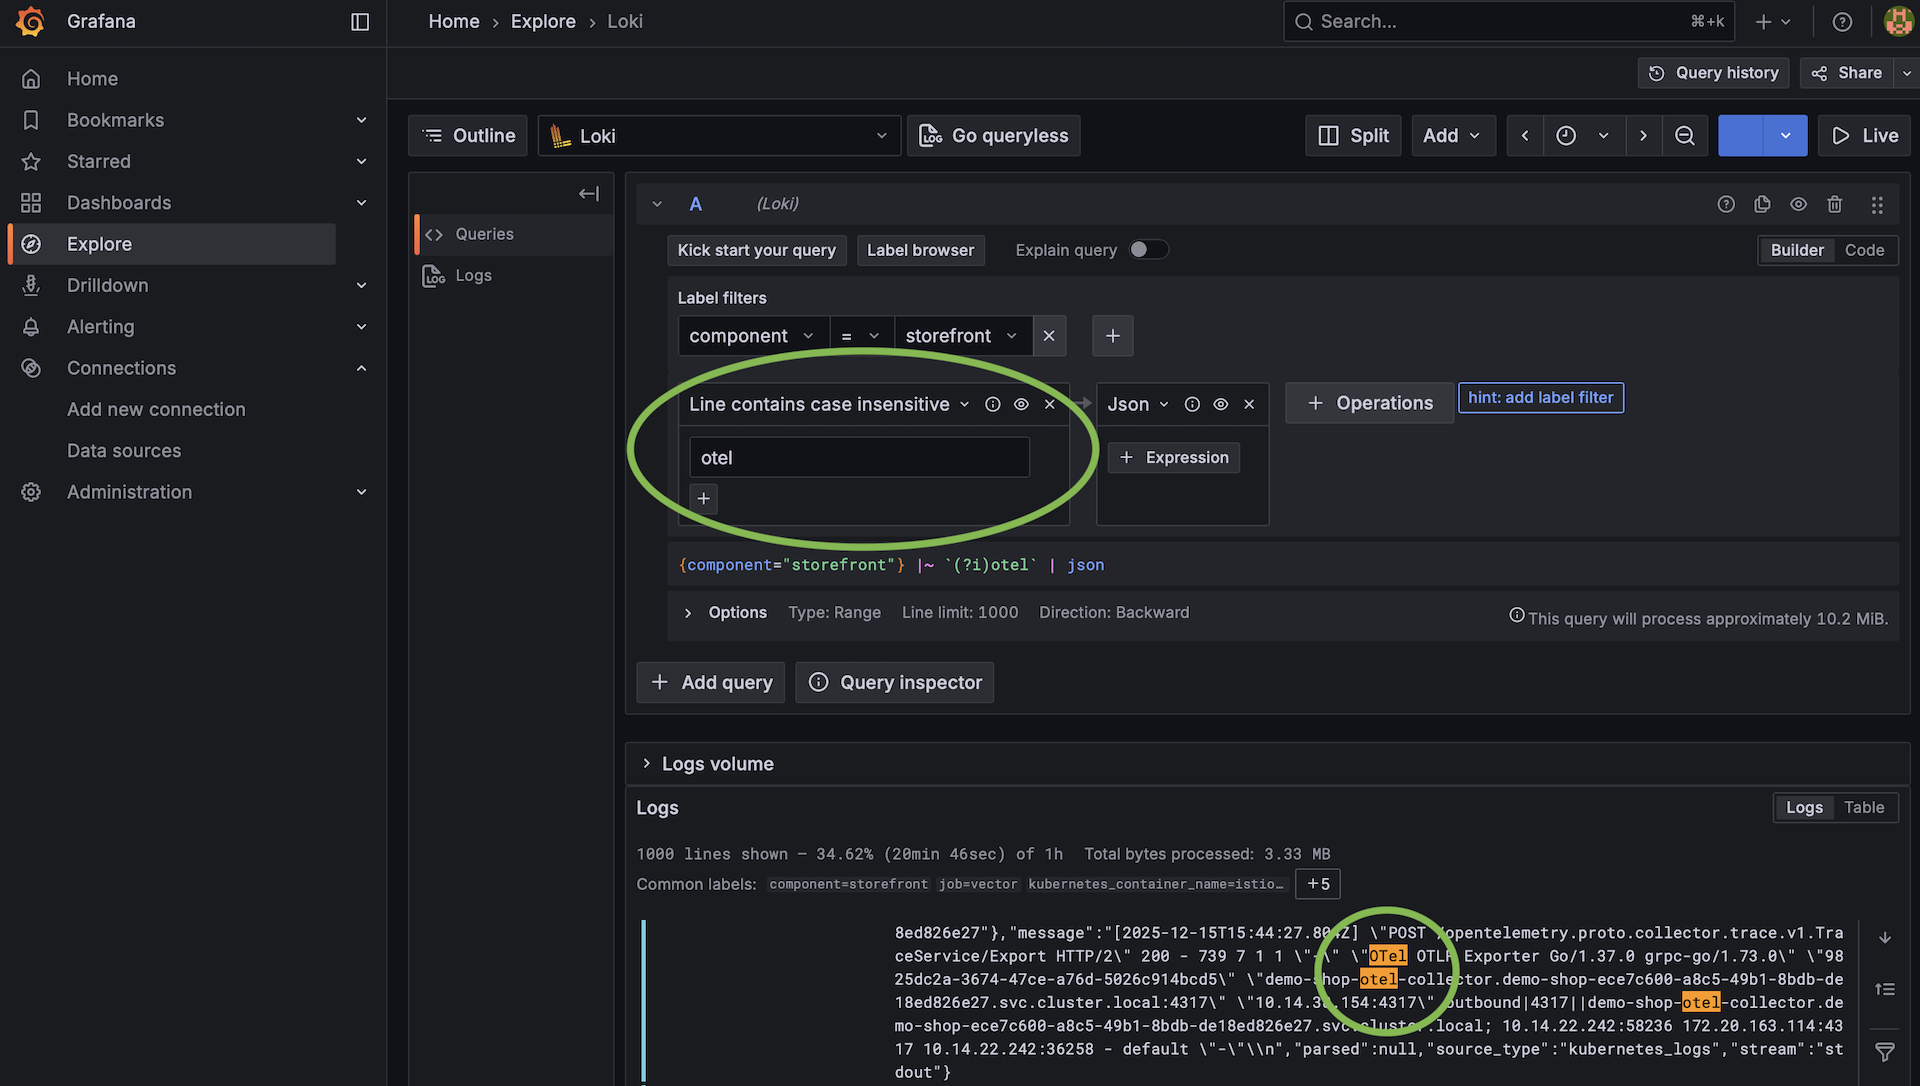
- Open the Explore tab.
- Select Loki as the data source.
- Filter logs by setting the
componentlabel to the service you want to inspect. - Run the query to view the logs for that component.

Tips
In the Explore view, you can refine results using the search box:
- Line contains — matches the exact string.
- Line contains case-insensitive — recommended, as it matches the string regardless of the letter case.
A predefined dashboard named Logs Dashboard is available. It displays the log ingestion volume and includes a built-in case-insensitive search box.

Log retention
Shopware PaaS Native keeps your latest logs available for review. Logs older than 45 days are automatically removed.